How To Export Data From Google Analytics To Excel


Digital Analytics tools such as Google Analytics use a simple data model to organize the collected and analyzed data. The basic digital analytics model is comprised of three basic components:
• Users: A user is one who visits your websites or mobile apps.
• Sessions: It is the time period for which the user visits your website.
• Interactions: Interactions are activities done by users during a session.
Exemplified: For a deeper understanding, consider an example of a customer who visits a shop. A customer can visit the shop for a single or multiple times. Also he can have one or many interactions with the shop owner. If he does not get a particular item he may return. This is 1 interaction. In case he finds a desired item, he will take it and pay for it. These are 3 transactions.
Simplified: In Google Analytics’ terms; a customer is a user, visits to the shop are sessions, and what the customer does there are – transactions. A user can visit your website a single time and might go back. This is a single transaction. Or he can stay on your website, browse it and find what is required. These are three transactions. In Google Analytics each individual transaction is termed as a Hit.
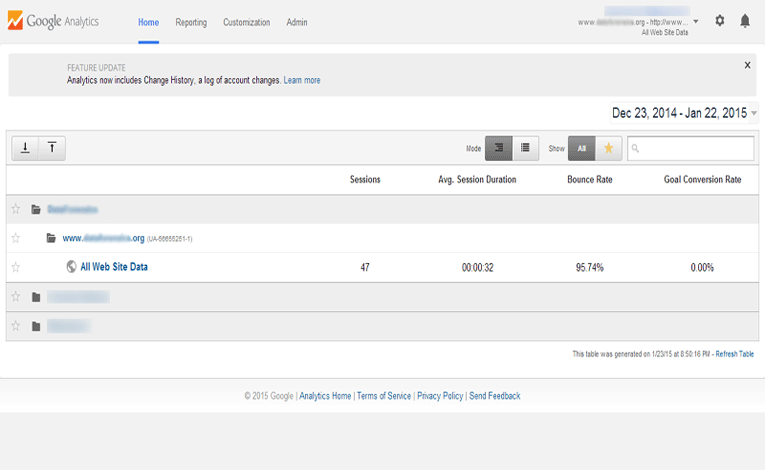
Database Components Of Google Analytics
Google Analytics is a platform which is used to assemble and analyze the data that has been collected from various websites and applications. Organizations deploy Google Analytics to understand the behavior of their customers via their interaction with the websites and applications. You can use Google Analytics to store offline business data as well. The point that has to be kept in mind is that you should have an effective way to send this data to your Google Analytics account. There are four main components of Google Analytics which work together to assemble, customize and survey the data.
1) Collection
Collection is basically collecting the data or information in your Google Analytics account. For collecting the data you have to add Google Analytics code to the website or mobile application that you need to analyze.
<head>
<analytics code>
</head>
This code is also called as tracking code. It tells Google Analytics to gather information about particular user interactions and data that needs to be collected. The analytic code is written in JavaScript if data from a website needs to be collected and is written in SDK if we need to collect data from a mobile application. Each time a tracking code is enabled it keeps track of user’s activities. It collects the information like the title of the website visited. Then the collected data is wrapped in a hit and is then passed on to server for processing.
1) Processing
The raw data collected is processed with the help of inbuilt settings in Google analytics. These configuration settings are also termed as configuration and process data in form of hits. One thing that is to be kept in mind is once the data has been processed, it cannot be retrieved back in its original form. For example if you want to filter out the hits from your employees you can apply filter while processing the hits. Once this data gets processed you will not get the report of hits from your employees and you will not be able to recover the lost data.
2) Configuration
You can configure Google Analytics to retrieve data from Google as well as non-Google applications. You can import data from Google AdWord and Google Webmaster Tools in order to process them. While processing the configuration settings prompt Google Analytics to include or exclude selected data from getting entered in the record.
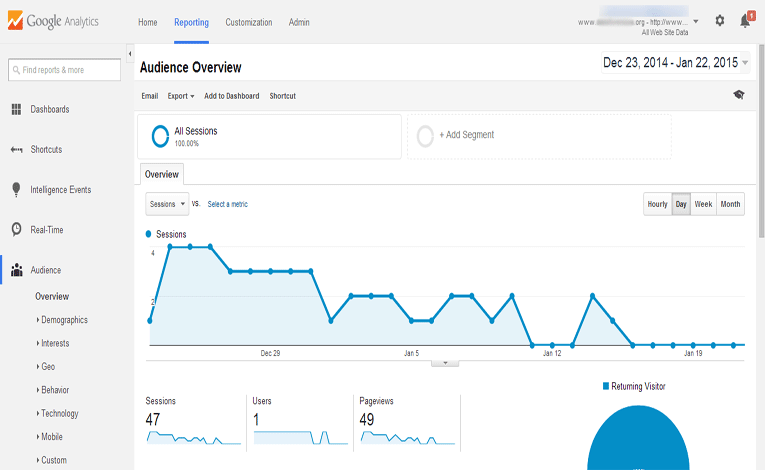
3) Reporting
After processing the data, we can access the report or result with the help of reporting interfaces. you can use Google Analytics reporting APIs to generate to extract your data. When you make request to get a report of your report through API you can receive your data in a moment. You can export the reports in the form of PDF, CSV and TSV formats.
Steps To Know How To Export Data From Google Analytics to Excel
The Analytics report gets exported in the same manner in which it is displayed. If any changes in date or other settings are to be made, they should be done before exporting.
To export a report that contains up to 500 rows
1) Open the report that you want to export.
2) Above the report title, select export option.
3) Select TSV For Excel or select Excel (XLSX) format.
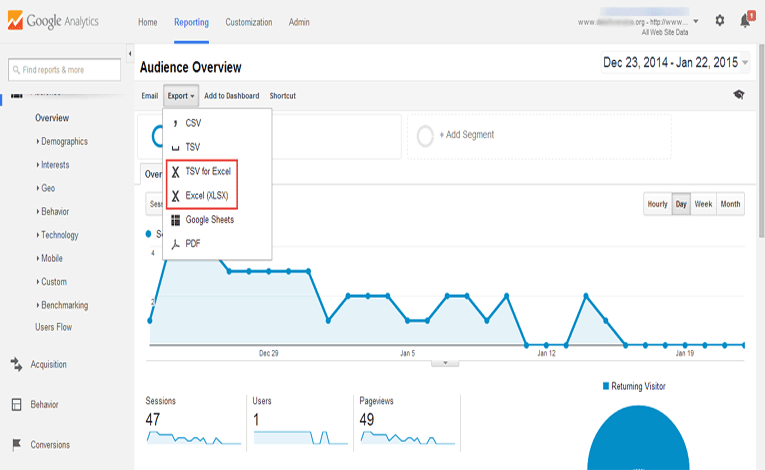
4) The report will get downloaded and will be available in your download documents.
In case your report contains more than 500 rows
You can have more than 500 rows if you want a report of all the keywords which sent traffic to your website. You can use the method mentioned below:
1) Open the report that you want to export.
2) Set the Show Rows selector to 500.
The URL will show following information-explorer-table.rowCount%3D500 where 500 indicate the number of rows in the report.
3) You can change the row count according to the number of rows you want in your report. For example if you want 800 rows in your report the URL will show following information- explorer-table.rowCount%3D800
4) Select the Export tab and click on CSV option.
Note: Loading so many rows at a time may cause load increase and also may lead to timeouts.